About
This page shows you how to debug Javascript remotely from IDEA in Chrome/Firefox.
Steps
Prerequisites / Configuration
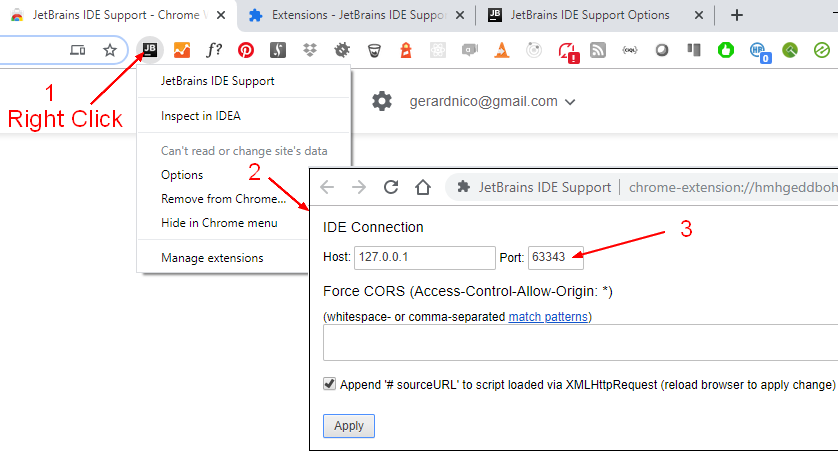
Chrome/Firefox Extension
- Install the Idea Chrome Extension
- Verify the port of the default webserver
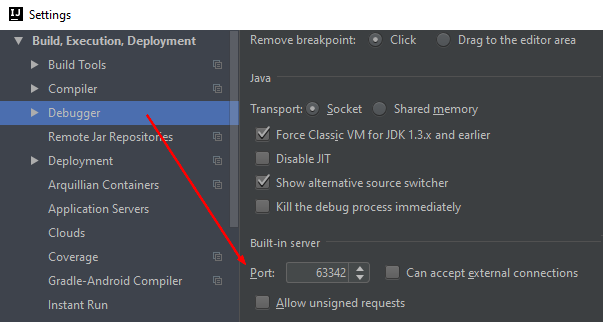
- Configure it in the chrome extension. If the default port of the built-in server (63342) is already bound (for instance, if some IDE is already running) the next free port is used (usually 63343).
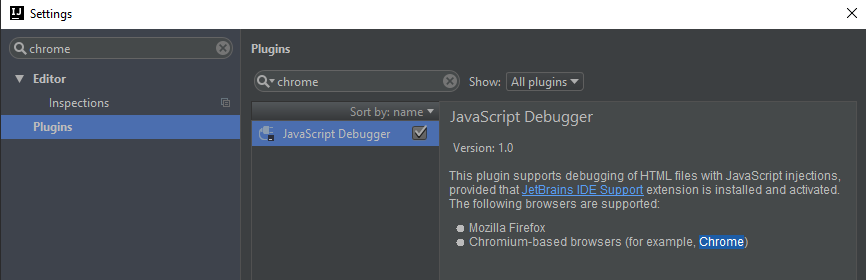
Idea Plugin
Run
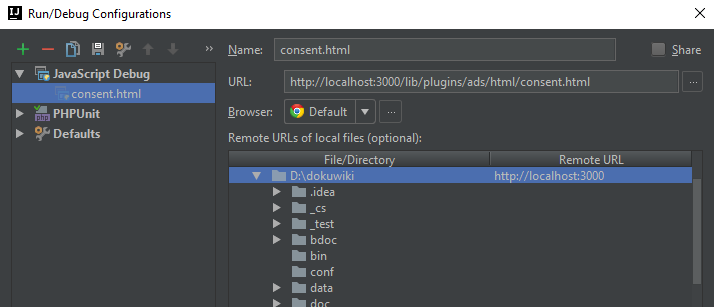
In the run/debug windows, before starting the run, you need to map the first part of the URL (https://hostname:port) to the location in your project.
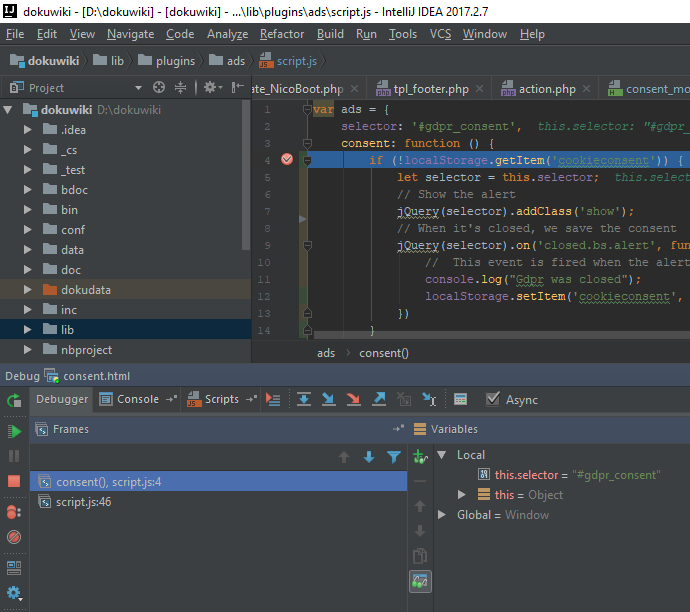
Debug
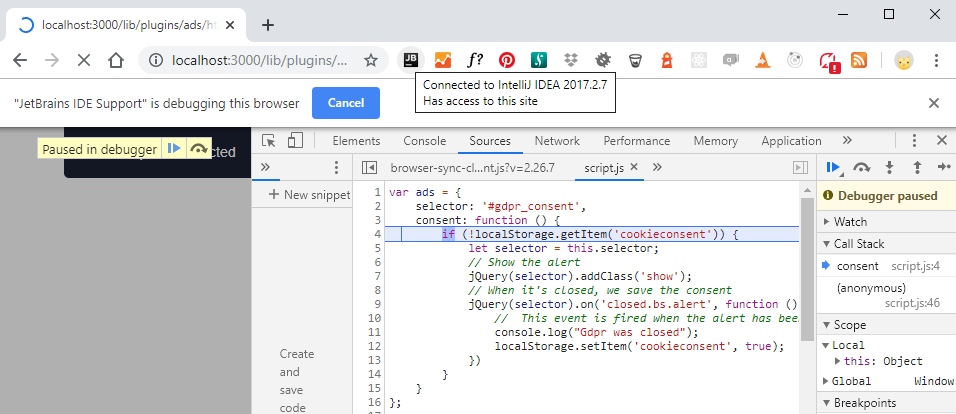
When starting a run debug, you can see by opening the devtool (F12) that the debug session in the browser is in sync with the debug session inside IDEA.
- The debug session in the browser
- The debug session in IDEA