About
This article talks about the Javascript debugger present in the browser and shows you how to use it.
Articles Related
Steps by Step
The debugger keyword
The first and easiest way to use the browser debugger is to add inside your Javascript the debugger keyword.
Steps:
- Add the debugger word in your code where you want your breakpoint. Example:
// code before
debugger;
// code after
- Refresh the page (F5)
- The debugger should stop and open the source tab on the line of the debugger keyword.
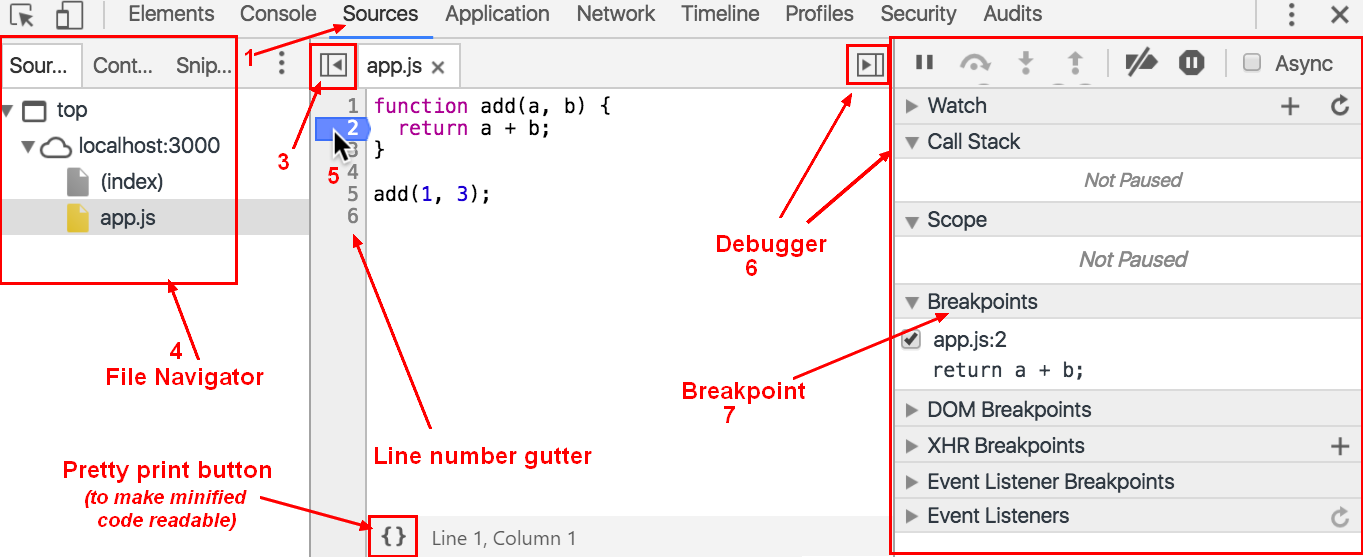
Add a breakpoint
You may also add a breakpoint by right clicking on the script line.