About
gnuplot is a command-line driven interactive function plotting utility.
Articles Related
Characteristic
- 2D and 3D
- case sensitive
- plugin
- output:
- interactive screen terminals (with mouse and hotkey input),
- direct output to pen plotters or modern printers,
- and output to many le formats (eps, emf, g, jpeg, LaTeX, pdf, png, postscript, …)
Grammar
- end of command ; or eol
- command may spawn several line when the last character of a line is a backslash (\).
- ! start an OS command
Installation
- Go ahead to the repo
- and download the windows installer file (example: gp526-win64-mingw_2.exe)
Getting started
Start gnuplot
gnuplot
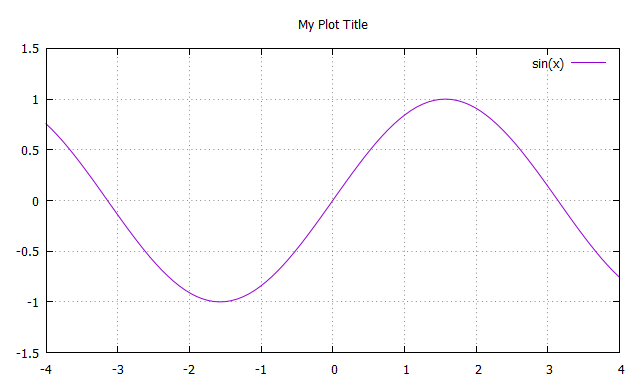
First plot
set title "My Plot Title";
set xrange[-4:4] # Controls the range of values on the x axis
# unset xrange to disable it
# reset to remove all settings
set yrange[-1.5:1.5] # Controls the range of values on the y axis
set key # Add a legend - set nokey to remove
plot sin(x);  # plot is the primary command for drawing plots
# You may give several function
# plot (x/4)**2, sin(x), 1/x
print "all done!"
Adjust and redraw
- Replot
set title "My Sin Plot";
replot
Get help
help
help plot # help on one command
Change the output format
- Svg
set term svg
set output 'sin.svg'
replot
<?xml version="1.0" encoding="windows-1252"  standalone="no"?>
<svg
 width="600" height="480"
 viewBox="0 0 600 480"
 xmlns="http://www.w3.org/2000/svg"
 xmlns:xlink="http://www.w3.org/1999/xlink"
>

<title>Gnuplot</title>
<desc>Produced by GNUPLOT 5.2 patchlevel 6 </desc>

<g id="gnuplot_canvas">

<rect x="0" y="0" width="600" height="480" fill="none"/>
<defs>

	<circle id='gpDot' r='0.5' stroke-width='0.5' stroke='currentColor'/>
	<path id='gpPt0' stroke-width='0.222' stroke='currentColor' d='M-1,0 h2 M0,-1 v2'/>
	<path id='gpPt1' stroke-width='0.222' stroke='currentColor' d='M-1,-1 L1,1 M1,-1 L-1,1'/>
	<path id='gpPt2' stroke-width='0.222' stroke='currentColor' d='M-1,0 L1,0 M0,-1 L0,1 M-1,-1 L1,1 M-1,1 L1,-1'/>
	<rect id='gpPt3' stroke-width='0.222' stroke='currentColor' x='-1' y='-1' width='2' height='2'/>
	<rect id='gpPt4' stroke-width='0.222' stroke='currentColor' fill='currentColor' x='-1' y='-1' width='2' height='2'/>
	<circle id='gpPt5' stroke-width='0.222' stroke='currentColor' cx='0' cy='0' r='1'/>
.........
- Go back to a terminal output
set term wxt
Create a function
foo(x)=sin(x)+1 # a vertical translation
plot foo(x)
Start a OS command
- where are we
!pwd # linux
!cd #windows
C:\gnuplot\bin
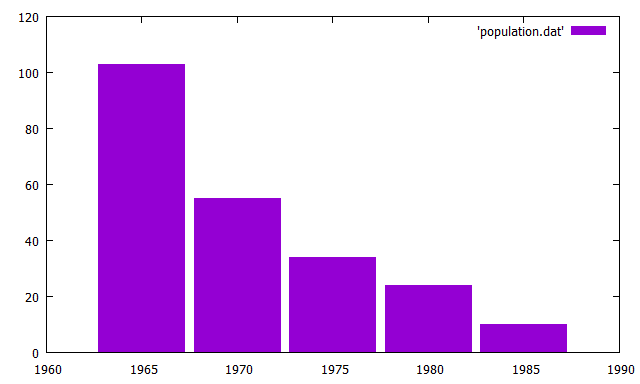
Use a data file to create a bar chart
- Data
1965   103
1970   55
1975   34
1980   24
1985   10
- Command
reset # to unset all env variable
set yrange [ 0 :] # To see the xaxis a y=0
plot 'population.dat' with boxes
# box style
set boxwidth 0.9 relative
set style fill solid 1.0
replot