About
Graph and axis title
Articles Related
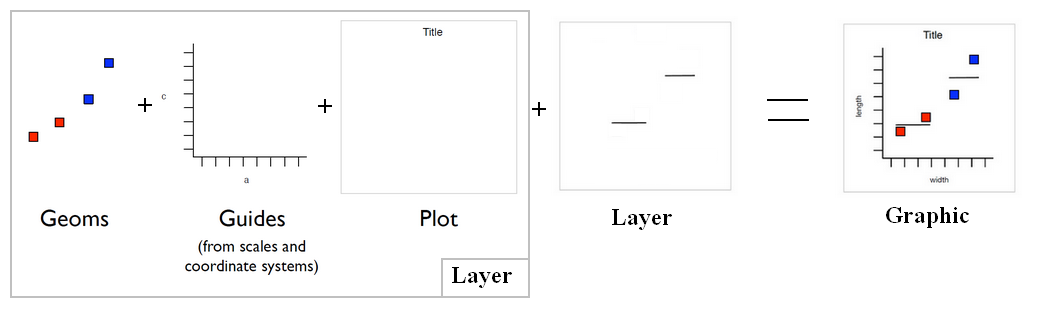
Title
Plot
labs(title = "New plot title")
# or
ggtitle ("New plot title")
Axis
labs(x = "New x label")
labs(y = "New y label")
# or
xlab("New x label")
ylab("New y label")
Legend
labs(color = "New Legend Color")