About
Aesthetic are plots parameters that are given by the data.
For parameters that are not related to the data, see Ggplot - Theme
Such as:
- coordinate x and y.
- Color:
- group - How the data are grouped (Default to the discrete value of the plot)
- weight - The variable to be summed.
- shape - It will use another shape for each point
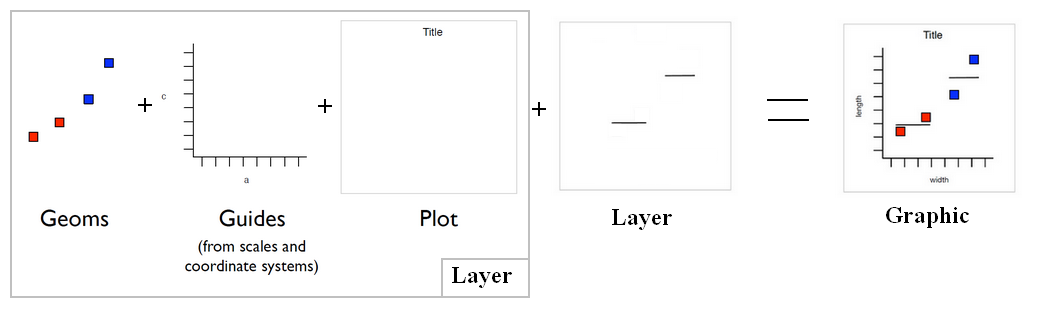
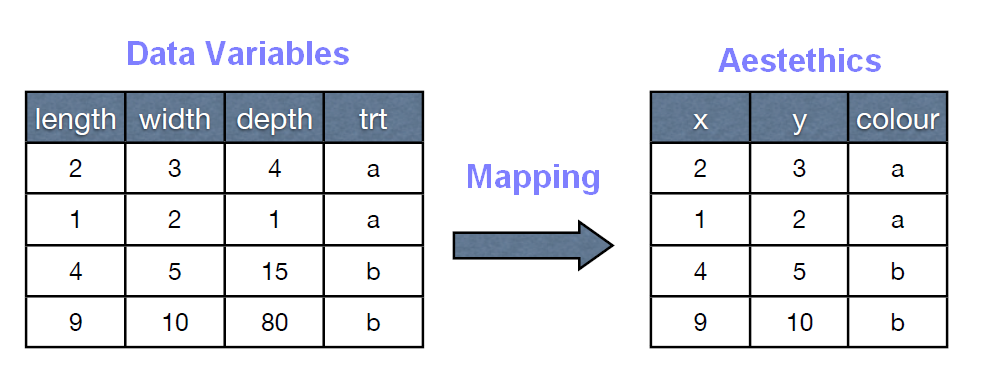
The aes function maps aesthetic to data frame variable.
Articles Related
Syntax
mapping = aes(x=carat, y=price)
The aes function (map|set):
- the variable carat to x
- and the variable price to y.
Mappings usually stay the same on a plot, so they are stored as defaults
Example
# The carat variable will be x and the prices will be y
p <- ggplot(diamonds, aes(x=carat,y=price))

# This code will map the colour to the green variable
p + geom_point(aes(colour = "green"))

# This code will show the colour green for all geoms
p + geom_point(colour = "green")
ggplot(diamonds, aes(x=carat, y=price))
+ geom_point(aes(colour = carat))
- fill. To slice an histogram, area with colour.
ggplot(diamonds, aes(x=price))
+geom_histogram(aes(fill = clarity))