About
The profiler in Xdebug outputs profiling information in the form of a cachegrind compatible file.
Steps
Xdebug installed and configured
Install xdebug and set the profiler php.ini configuration file
Open devtool
Open your browser devtool on the network tab. It allows to get back later the name of the file where the profiling data are saved.
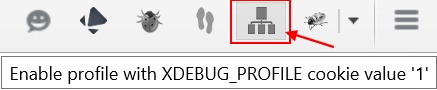
Enable Profiling via the Xdebug Browser Extension
Start the debugger with profiler enable. Starting The Debugger
With a How to install Php Xdebug ?, enable profiling
Start. navigate, refresh your page
Execute the HTTP request with your browser by:
- navigating
- or refreshing your page (f5)
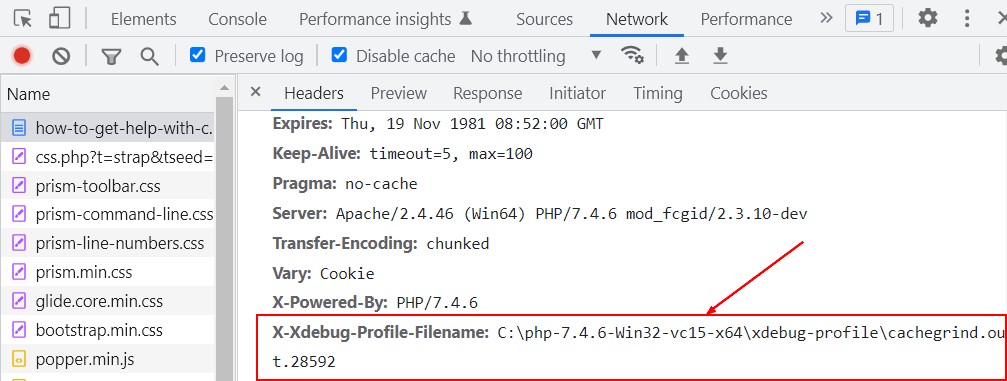
Retrieve the profiling file name from devtool
On the devtool, in the response header, you should see the x-xdebug-profile-filename'header.
This header holds the location of the profiling file, copy it.
Analyze with a Xdebug compatible profiling tool
- WinCacheGrind
- Webgrind
- or your IDE: intellij
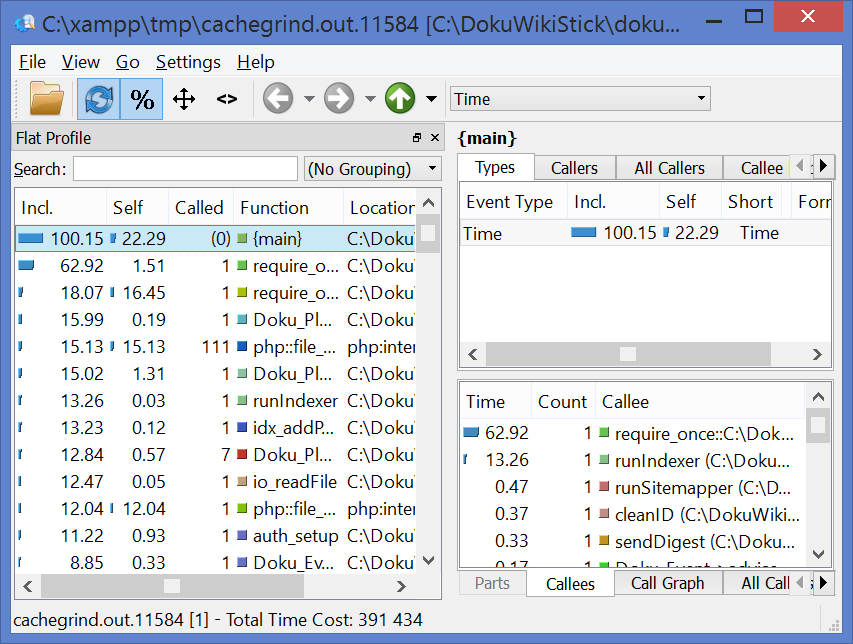
kcachegrind
The format cachegrind can be read by kcachegrind :
- Linux: The KCacheGrind
- Windows: QCacheGrind (QCacheGrind is KCacheGrind without KDE bindings)
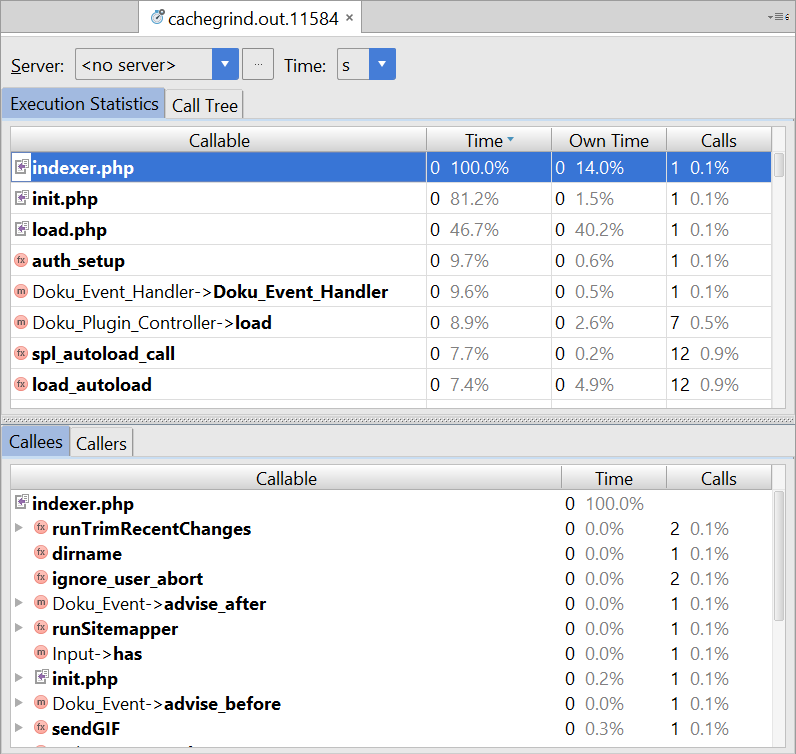
Intellij
- Intellij 1) > Tools | Analyze Xdebug Profiler Snapshot.
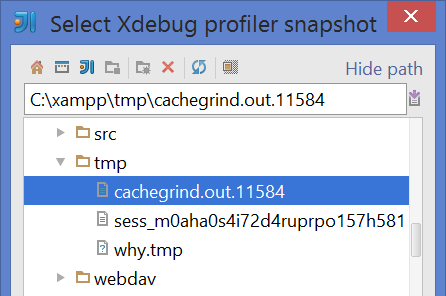
and you will see: