About
Debugger in Java
When you enable debugging, you enable both local and remote debugging.
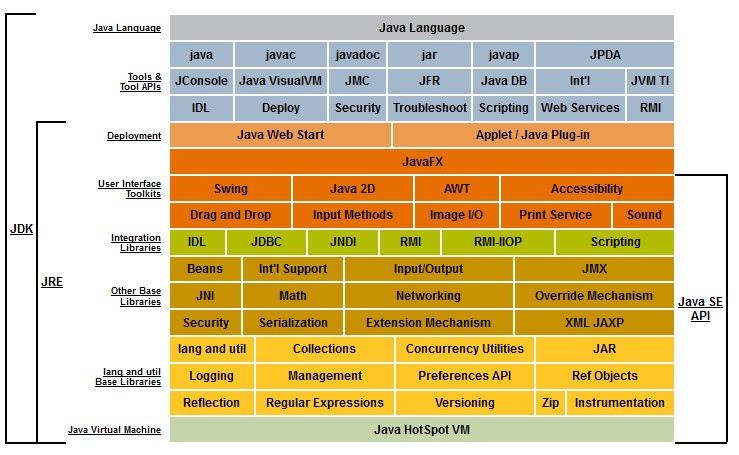
The Java Platform Debugger Architecture (JPDA) is the architecture designed for use by debuggers and debugger-like tools. It consists of two programming interfaces and a wire protocol.
Articles Related
Jdb
The jdb utility is included in the JDK release as the example command-line debugger. The jdb command demonstrates the Java Platform Debugger Architecture (JDBA)
Connect the debugger to a JVM
There is a lot of way to connect the debugger to the JVM.
Java
- loading in-process debugging libraries and specifiing the kind of connection to be made.
java -agentlib:jdwp=transport=dt_socket,server=y,suspend=n MyClass
where:
- suspend=y/n , controls whether the JVM should wait for the debugger to attach before starting up.
Attach
- attaching the jdb command to the JVM:
jdb -attach 8000
Client
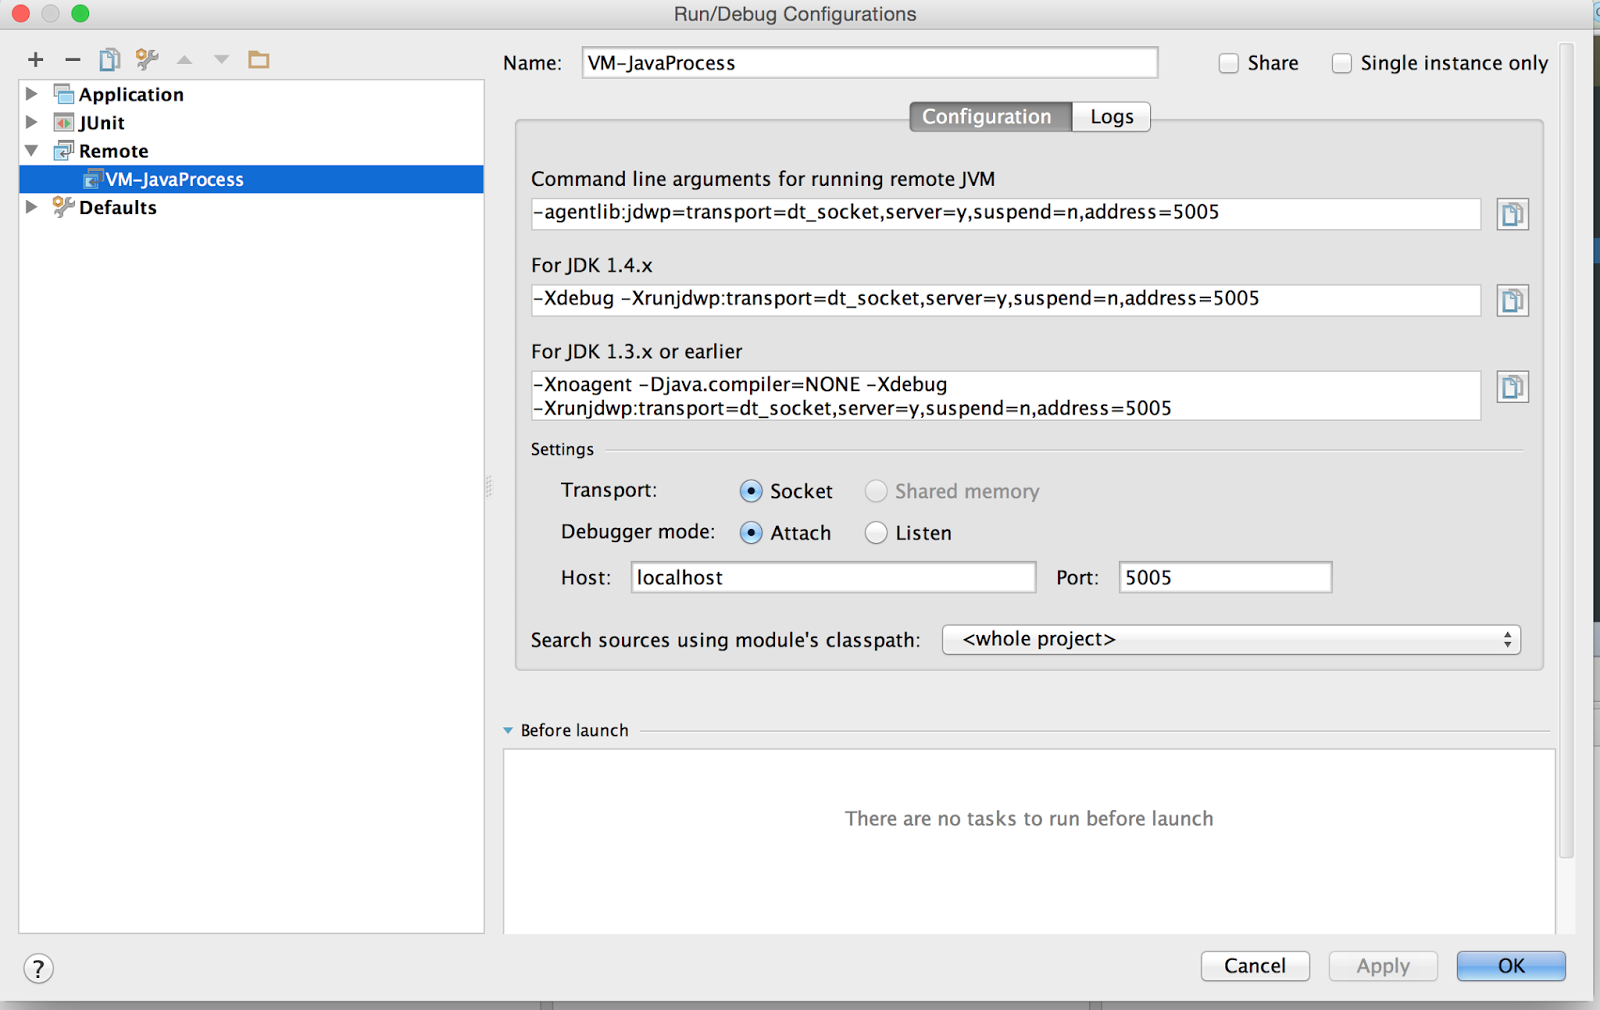
Intellij
https://www.jetbrains.com/idea/help/run-debug-configuration-remote.html
- run > edit configurations > + > remote
Server
Maven
- Maven 2.0.8 or newer: run the “mvnDebug” command in place of “mvn”
- Maven <2.0.8: uncomment the following mvn.bat line
@REM set MAVEN_OPTS=-Xdebug -Xnoagent -Djava.compiler=NONE -Xrunjdwp:transport=dt_socket,server=y,suspend=y,address=8000
See Maven: Enable remote debugging command line option
X options are options of the JRockit JVM.
Jdwp
Java Debug Wire Protocol (JDWP) defines the format of information and requests transferred between the debuggee process and the debugger front-end.