About
A session can hang for a lot of reason that are called wait event.
A lock can give also the same impression
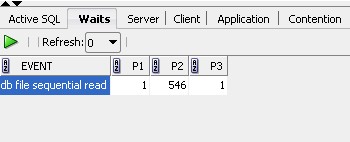
From SQL Developer, in the Monitoring Session Tools:
Articles Related
Classes/Group/Type of Wait Events
Every wait event belongs to a class of wait event. The following list describes each of the wait classes.
- Administrative: Waits resulting from DBA commands that cause users to wait (for example, an index rebuild)
- Application: Waits resulting from user application code (for example, lock waits caused by row level locking or explicit lock commands)
- Cluster: Waits related to Real Application Cluster resources (for example, global cache resources such as 'gc cr block busy'
- Commit: This wait class only comprises one wait event - wait for redo log write confirmation after a commit (that is, 'log file sync')
- Concurrency: Waits for internal database resources (for example, latches)
- Configuration: Waits caused by inadequate configuration of database or instance resources (for example, undersized log file sizes, shared pool size)
- Idle: Waits that signify the session is inactive, waiting for work (for example, 'SQL*Net message from client')
- Network: Waits related to network messaging (for example, 'SQL*Net more data to dblink')
- Other: Waits which should not typically occur on a system (for example, 'wait for EMON to spawn')
- Scheduler: Resource Manager related waits (for example, 'resmgr: become active')
- System I/O: Waits for background process IO (for example, DBWR wait for 'db file parallel write')
- User I/O: Waits for user IO (for example db file sequential read and db file scattered read, all events with the term read.)
API / View
Information about wait events is displayed in this views:
- the vsession
- and in three following dynamic performance views:
- VSESSION_WAIT,
- VSESSION_EVENT,
- and VSYSTEM_EVENT
If the configuration parameter TIMED_STATISTICS is set to true, you can now how long each resource was waited for.
VSESSION_WAIT
- VSESSION_WAIT displays the events for which sessions have just completed waiting or are currently waiting.
Because VSESSION_WAIT is a current state view, it also contains a finer-granularity of information than VSESSION_EVENT or VSYSTEM_EVENT. It includes additional identifying data for the current event in three parameter columns: P1, P2, and P3.
For example, VSESSION_EVENT can show that session 124 (SID=124) had many waits on the db file scattered read, but it does not show which file and block number. However, VSESSION_WAIT shows:
- the file number in P1,
- the block number read in P2,
- and the number of blocks read in P3
(P1 and P2 let you determine for which segments the wait event is occurring).
Others
- VSYSTEM_EVENT displays the total number of times all the sessions have waited for the events in that view.
- VSESSION_EVENT is similar to VSYSTEM_EVENT, but displays all waits for each session.