About
The t-distributions are used to calculate the p-value (basically you look it up in a table, nowadays software will compute it).
It's basically a normal random variable except for small numbers of samples.
They are a Family of t distribution depending on sample size. They are all sampling distributions.
As your sample size get smaller, your t distribution gets a little wider which means you need a larger t value to get out into the extremes to get a low p-value because the p value is the probability of obtaining these data or more extreme (The extremes) outcomes given the assumption that the null hypothesis is true.
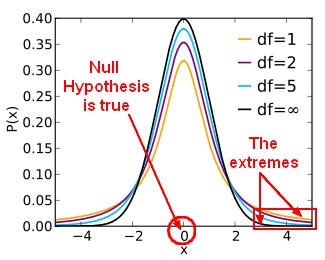
In contrast to the z distribution, there are multiple t distributions. The correct distribution to use is determined by the Degrees of freedom (df).
The null hypothesis being true will gives a t-value of zero.
The p-value comes from the t-value and its corresponding t-distribution which depends on sample size. The p-value is just the area under the t distribution curve at that particular t value and beyond.
So if you:
- are way out in the extremes, you're going to have a low p-value. You'll reject the NULL.
- fall around the middle, then you'll have a high p-value. You'll retain the NULL.
p-value < 0.5 means less than 5% of the distribution are in the extreme positive tail of the t-distribution or in the extreme negative tail of the t-distribution.