About
Data mining is an experimental science.
Data mining reveals correlation, not causation.
- With good data, you will make good algorithm. The most preferable solution is then to work on good features.
- Good features: Use a simple algorithm (linear regression for example).
- No meaningful features: Use an “intelligent” algorithms which have a tendency to overfit
- Decide which model to use
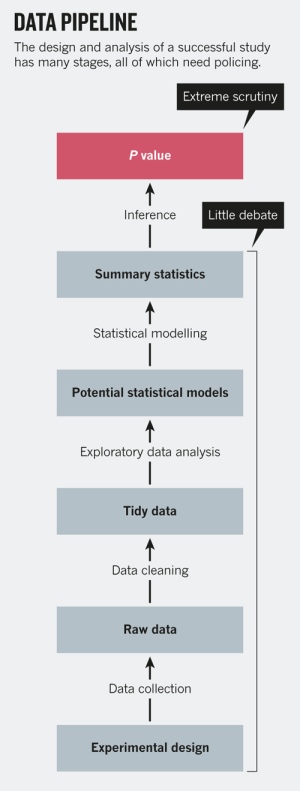
From data to information (patterns, or expectations, that underlie them)
Any data scientist worth their salary will say you should start with a question, NOT the data,
Most #bigdata problems can be addressed by proper sampling/filtering and running models on a single (perhaps large) machine …
Observation against Perturbation
The only way to �find out what will happen when a complex system is disturbed is to disturb the system, not merely to observe it passively
In other words, if you want to make a causal statement about a predictor for an outcome, you actually have to be able to take the system and perturb that particular predictor keeping the other ones fixed.
That will allow you to make a causal statement about a predictor variable and its effect on the outcome. It's not good enough simply to observe some observations from the system. Data from this observation can't conclude to causality.
So in order to know what happens when a complex system is perturbed, it must be perturbed not only observed.
Lifecycle
The following paragraph must be merged in one.
Data Preparation
Null
- Define the question of interest, Identify the problem
- (Get|Collect) the data
- Data Preparation: Prepare the data (Integrate, transform, clean, filter aggregate) What is Data Processing (Data Integration)?
- (Explore|Interact) with the data (And always visualize the data to understand the distribution. See the Anscombe's quartet to understand why ?)
- ? train a model to distinguish between your training set & unlabeled data. If it works, your training data may be incomplete! Jake van der Plas
- (Build|Fit) a model
- Evaluation is how to determine if the classifier is a good representation.
- Communicate the results
- Make the analysis reproducible
- Optimization
- Build the representation that maximize accuracy
- How to make the evaluation more efficient by reducing the search space.
Classifier
- Choose a classifier with a knowledge representation (how the data is classified - decision tree, rule, …)
Learning is iterative:
- Apply Model to data
- Observe Errors
- Update Model
Second
- Ask question. “tell me something cool about the data” is not enough!
- Collect Data
- Clean Data
- Transform:
- Center (Normalize) (Standardize): Transform numeric attributes to have zero mean (or into a given numeric range) (or to have zero mean and unit variance)
- Discretize: Discretize numeric attributes to have nominal values
- PrincipalComponents (PCA): Perform a principal components analysis/transformation of the data
- RemoveUseless: Remove attributes that do not vary at all, or vary too much
- TimeSeriesDelta, TimeSeriesTranslate: Replace attribute values with successive differences between this instance and the next
- Deploy
Three
The phases of solving a business problem using Data Mining are as follows:
- Problem Definition in Terms of Data Mining and Business Goals
- Data Acquisition and Preparation
- Deployment
Supervised
For a Supervised problem:
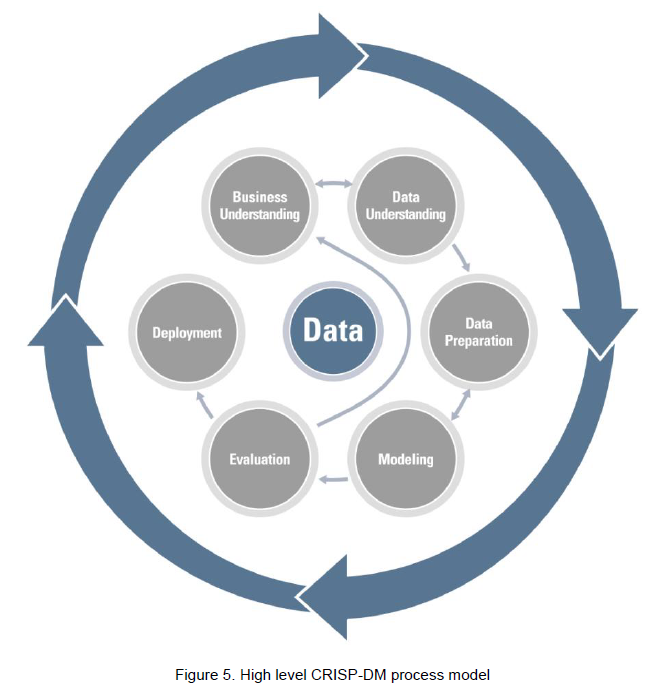
Cross Industry Standard Process Model for Data Mining
The Cross Industry Standard Process Model for Data Mining (CRISP-DM). From: An Oracle White Paper - February 2013 - Information Management and Big Data A Reference Architecture
- an Analyst will first build both a business and data understanding in order to develop a testable hypothesis.
- data preparation:
- Identify data of interest
- Data exploration with data Profiling, Data Quality, Statistics and viz tools
- models built
- evaluated (both technically and commercially) before deploying
Uber
https://eng.uber.com/michelangelo/ 6 steps:
- Manage data
- Train models
* Evaluate models
- Deploy models
- Make predictions
- Monitor predictions
A Model is dynamic
When Google rolled out flu stories in Google News, people started reading about flu in the news and searching on those stories and that skewed their results. During the period from 2011 to 2013, it overestimated the prevalence of flu (factor of two in 2012 and 2013). They needed to take this new factor into account.
Google Flu Trends teaches us that the modelling process cannot be static, but rather we must periodically revist the process and understand what underlying factors, if any, may have changed.
Pitfall / Pratfall
- Pitfall: A hidden or unsuspected danger or difficulty
- Pratfall: A stupid and humiliating action