About
The error rate is a prediction error metrics for a binary classification problem.
The error rate metrics for a two-class classification problem are calculated with the help of a Confusion Matrix.
The below confusion matrix shows the results for a two-class classification problem where the target can take the value:
- Positive
- Or Negative

True = Truth = Good Predictions
Articles Related
Rate
False rate are not desired while true rate are.
For instance, in a spam application, a false negative will deliver a spam in your inbox and a false positive will deliver legitimate mail to the junk folder.
False
False Positive
False Positive (also known as false alarm) are predictions that should be false but were predicted as true
False positive rate: The fraction of negative examples (No, False, -) that are classified as positive (Yes, True, +) <MATH> \begin{array}{rrl} \text{False positive rate} & = & \frac{\text{False Positive}}{\text{False Positive} + \text{True Negative}} \\ & = & \frac{c}{c + d} \\ & = & 1- \text{accuracy of the other class} \end{array} </MATH>
False Negative
False Negative: Predictions that should be true but were predicted as false
False negative rate: The fraction of positive examples that are classified as negative <MATH> \begin{array}{rrc} \text{False negative rate} & = & \frac{b}{a + b} \end{array} </MATH>
True
True Positive
True Positive: positive instances that are correctly assigned to the positive class
The TP rate is the same as the accuracy for the first class.
True Positive rate: The fraction of positive target that are classified as positive <MATH> \begin{array}{rrl} \text{True positive rate} & = & \frac{\text{True Positive}}{\text{True Positive} + \text{False Negative}} \\ & = & \frac{a}{a + b} \\ & = & \text{Accuracy on the first class} \end{array} </MATH>
How to decrease it
In a probability regression classification for a two-class problem, the threshold is normally on 50%. Above the threshold, it will be 1 and below it will be 0.
<MATH> \hat{Pr}(Y = Yes|X ) \geq threshold </MATH>
By changing this classification probability threshold, you can improve this error rate.
In a regression classification, algorithm, you capture the probability threshold changes in an ROC curve.
For instance: (For a two class, the threshold is 0.5)
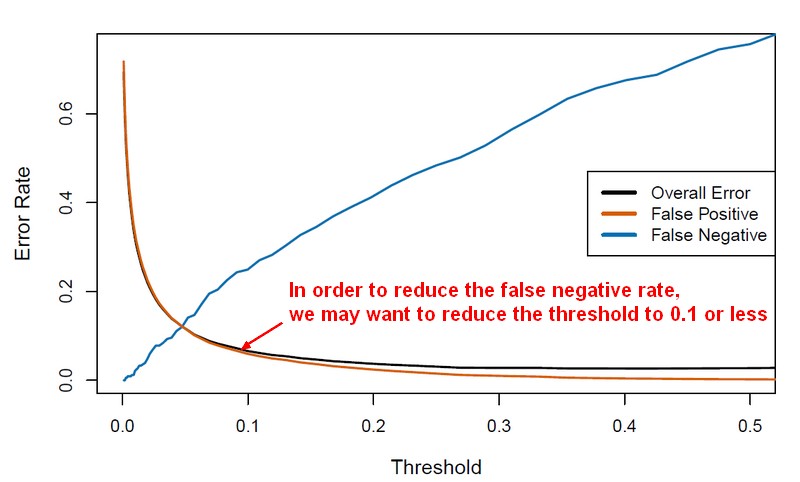
The Total Error is a weighted average of the False Positive Rate and False Negative Rate. The weights are determined by the Prior Probabilities of Positive and Negative Responses. Positive responses are so uncommon that the False Negatives makes up only a small portion of the Total error therefore Total Error keep going down even though the False Negative Rate increases.
Others Metrics
Sensitivity / Specificity
Sensitivity
<MATH> \begin{array}{rrl} Sensitivity & = & \frac{a}{a+b} \\ \end{array} </MATH>
Specificity
<MATH> \begin{array}{rrl} 1-Specificity & = & 1-\frac{d}{c+d} \end{array} </MATH>
Lift , Precision, Recall
Lift , Precision, Recall are others Accuracy Metrics
<MATH> \begin{array}{rrl} Lift & = & \frac{\displaystyle \text{% positives > threshold}}{\displaystyle \text{% data set > threshold}} & = & \frac{\displaystyle {a/(a +b)}}{\displaystyle {(a + c)/(a + b + c + d)}}\\ Precision & = & \frac{\displaystyle a}{\displaystyle a+c}\\ Recall & = & \frac{\displaystyle a}{\displaystyle a+b}\\ \end{array} </MATH>