About
Comparison in Viz.
Same as Viz - (Change|Variation)
Articles Related
Grid
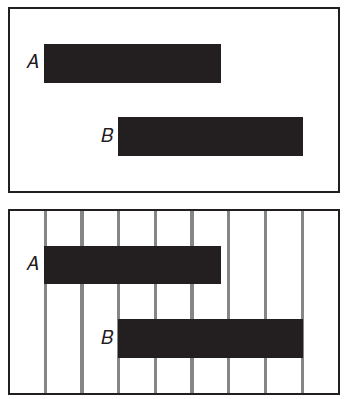
A Reference Grid Improves the Likelihood of perceiving a difference between shapes A and B. See weber_law
Weber Law
Ernst Heinrich Weber (1795–1878) was one of the first people to approach the study of the human response to a physical stimulus in a quantitative fashion.
Weber’s law was formulated by 19th century psychophysicist E. H. Weber.
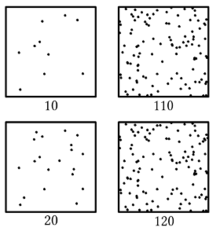
An illustration of the Weber–Fechner law. On each side, the lower square contains 10 more dots than the upper one. However the perception is different: On the left side, the difference between upper and lower square is clearly visible. On the right side, both squares look almost the same.
See JND below
just-noticeable difference (JND)
A just-noticeable difference or JND is the amount something must be changed in order for a difference to be noticeable, detectable at least half the time.
Also known as:
- the difference limen,
- differential threshold,
- or least perceptible difference.
The JND is a fixed proportion of the reference sensory level, and so the ratio of the JND/reference is roughly constant (that is the JND is a constant proportion/percentage of the reference level).
<MATH> k_{jnd} = \frac{dx}{x} </MATH> where:
- x is the visual property of an object (example: length of a segment, number of point, light intensity)
- dx is the difference in visual property of the second object
- k is the JND constant