About
A box plot is a good summary of a distribution and was invented by John Tukey.
The boxplot is a special case of the quantile function in that it only returns the 1st, 2nd and 3rd quantile.
Box plots are useful for comparing distributions, especially when you have multiple observations of the same event.
Articles Related
Definition
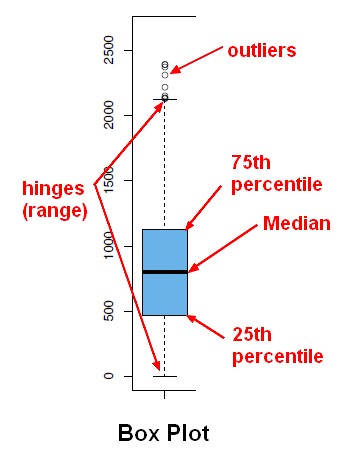
- The black line is the median.
- The top and bottom of the box are the quartiles.
- the 75th percentile is the top of the box
- the 25th percentile is the bottom of the box.
- A hinge is defined to be a fraction of the interquartile range and gives an indication of the spread.
- if data points fall outside the hinges, they're considered to be outliers.