HomeDataVizBinary
Table of Contents
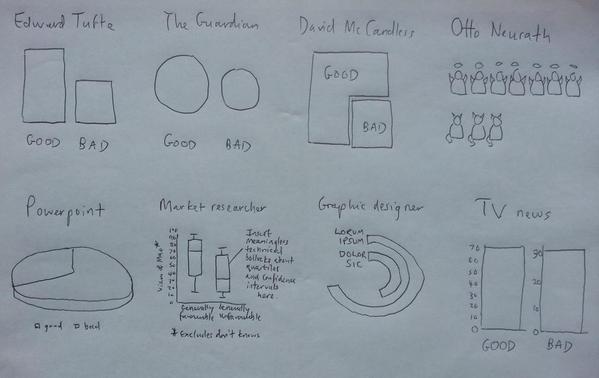
Mao was '70% good, 30% bad' according to the Chinese government. But how to visualise it…?