About
An area chart shows the trend of the contribution of:
- or by category.
It is basically a line graph for which the regions between lines are filled in.
Regions stack, adding up to the total value for each time period or category.
The space taken up by the area chart shows the actual percentages of usage
Articles Related
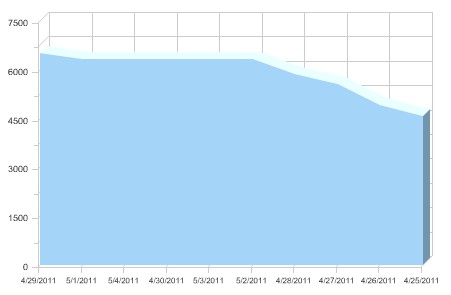
Example
Top 5 Web Browser
Top 5 web browser

Basic