About
Cpu time
The count of cycles, also known as clockticks, forms the basis for measuring how long a program takes to execute.
Articles Related
Definition
How do you measure Execution Time?
<MATH> \begin{array}{rll} && \text{Kernel} && \text{Time} \\ + &&\text{User} && \text{Time} \\ \hline \\ && \text{Total} && \text{Time} \end{array} </MATH>
| CPU Time | Running which code |
|---|---|
| Kernel (Sys) Time | Operating system code - the time of CPU spent on the kernel (system) code only within the given process - other processes and the time when our process is blocked are not included. |
| User Time | Time CPU spends running the program code (ie CPU time spent on non-kernel (user-mode) code only within the given process – so other processes and the time when our process is blocked are not included.). |
| Total time | User + Kernel |
| Real Time | Wall clock (total elapsed time) (can be lower than total time because of parallelism or longer because of wait) - user-perceived time it took to execute the command – from the start to the end of the call, including time slices used by other processes and the time when our process is blocked (e.g. I/O waiting) |
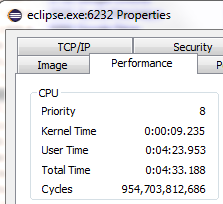
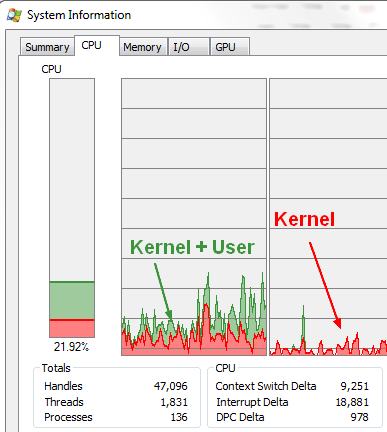
Process Explorer
CPU Time in process explorer
| The performance tab of a process in Process Explorer. | Red in the CPU usage graph indicates CPU usage in kernel-mode whereas green is the sum of kernel-mode and user-mode execution. |
 |  |
A data collector set can be configured via logman.exe to log the “% Processor Time” counter in the “Processor Information” object for this purpose.
Formula
Every conventional processor has a clock with a fixed cycle time (or clock rate). At every CPU cycle, an instruction is executed.
<MATH> \text{CPU Time} = \text{CPU cycles executed} * \text{Cycle times} </MATH>
<MATH> \text{CPU cycles} = \text{Instructions executed} * \text{Average Clock Cycles per Instruction (CPI)} </MATH>
Putting it all together: <MATH> \text{CPU Execution Time} = \text{Instructions count} * \text{CPI} * \text{Clock Cycle Time} </MATH> where:
<MATH> \begin{array}{rll} \text{Instructions Count} && = && \frac{\displaystyle Instructions}{\displaystyle Programs} \\ \text{CPI} && = && \frac{\displaystyle Cycles}{\displaystyle Instruction} \\ \text{Clock Cycle Time} &&= && \frac{\displaystyle Seconds}{\displaystyle Cycle} \end{array} </MATH>
Note:
- CPI is somewhat artificial (computed from the other numbers using) but it's seems to be intuitive and useful.
- Use dynamic instruction count (#instructions executed), not static (#instructions in compiled code)
Performance
Response time distributed through the request lifetime
Busy vs Wait
Percentage shown in monitoring tool is generally: <MATH> \text{CPU Busy vs Wait Event} = \frac{\text{User} + \text{Kernel}}{\text{Wallclock Time}} </MATH>
CPU Performance
<MATH> \text{CPU Performance} = \frac{1}{\text{Total CPU Time}} </MATH>
System Performance
<MATH> \text{System Performance} = \frac{1}{\text{Wallclock Time}} </MATH>
Units (Mhz to ns)
- Rate often measured in MHz = millions of cycles/second
- Time often measured in ns (nanoseconds)
<MATH> \begin{array}{rl} {X} \mbox{ MHz } && = && \frac{\displaystyle 1000}{\displaystyle X} \mbox{ ns} \\ 500 \text{ MHz} && \approx && 2 \text{ ns clock} \end{array} </MATH>
Documentation / Reference
- the time linux utility.