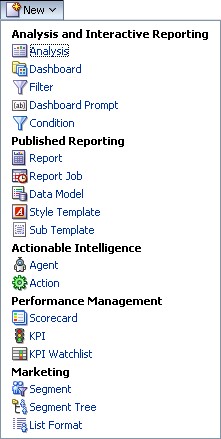
About
Map view is a new view in 11g that permit to include a mapviewer map in an answer. When you edit a map view and work with layers, you create formats for those layers.
For example:
- the floor maps of office buildings
- the appearance and presence of items such as countries, cities, and roads
A map view can show a map of a city with the zip codes color-coded by sales performance, while an image marker displays the average discount given per order.
To create a map view, you generally select attribute columns that are related to geography, such as Cities, States, or Regions. This geography columns must have been mapped to layers via the Administration pages. In this case, you see a map that uses the background map specified on the Administration page.
Articles Related
Functionality
A map view can be a Master, but never the Detail.
Map views offer the following functions:
- You can display multiple attribute columns and measure columns on a map view. Map views do not support hierarchical columns.
- You can format a map view, including with colors, bar graphs, pie graphs, variably sized bubbles, images, or colored shapes that provide the ability for binning and other formatting options.
- You can drill in information windows. When you hover over a value, you see a popup with information such as the geographic region (city, state, or country), the measures in the form of column names and column values and formatting metrics, and non-geographic data such as Year. You can click the value to display the actionable links for drilling in the information window, then click the appropriate link.
Changes to data are reflected in the map views, and users can perform the following tasks:
- Display data with a spatial attribute on a map:
- Display color-coded regions as thematic maps.
- Show point-based information, such as sales locations within territories.
- Zoom, pan, and drill to additional map detail.
- Use a map view to interact with other dashboard elements:
- Dashboard prompts drive map content (Geo Prompter).
- Interaction with the map view updates other dashboard content, including driving master detail interactions with other views.
- Show additional related contextual information by hovering the mouse pointer over map areas.
- Allow users to perform additional tasks via actions.
Terms
Feature
Format
Defines rendering properties for a feature.
For example, if the feature is a polygon that shows a county, then the format can define the fill color for the county or can define a pie graph to be drawn over the county. Formats are tied to a particular geographic level such as continent, country, region, state, or city.
| Type of Geometry | Format Possible |
|---|---|
| polygons | Color Fill, Bubble, Pie Graph, and Bar Graph |
| Point | Bubble, Variable Shape, Image, and Custom Point |
Layer
A layer in OBIEE is a theme for mapviewer.
Any collection of features and formats that have a common set of attributes and a location. For example, a layer that shows US states can include color coding of states by sales, as well as a pie graph that shows sales per brand for that state. In addition to the US states layer, you can use a layer that displays stores within a state as individual points, with popup notes that show sales for each store.
Layers are displayed on a background or template map. When you zoom in and out on the map, various layers are hidden or displayed.
Some layers must be enabled for data, so you can display it in the map. Other layers, such as one that shows roads, is not related to data.
Layers are collections of geometries that share common attributes. Layers can be either predefined or custom:
- A predefined layer is one whose geometry is defined in a spatial table in an Oracle Database. The administrator makes predefined layers available via the Administration pages.
- A custom point layer is one that you define while editing a map view
You can select layers to be visible or hidden on a map, but you cannot modify predefined layers. You also create formats to apply to the layers, such as colored regions, bubbles, points, or bar or pie graphs. Not all formats are available for all layer types. For example, point layers cannot have color fill formats.
Type
Layers can be of different types.
Polygon
A polygon layer represents regions, such as states. An example is a New England layer for the United States that consists of Connecticut, Maine, Massachusetts, New Hampshire, Rhode Island, and Vermont.
Point
A point layer represents specific points on a map, based on a coordinate system. For example, a point layer might identify the locations of warehouses on a map. The layer can use a different image for the type of inventory (electronics, housewares, garden supplies) in a set of warehouses to differentiate them from each other.
You can create a custom point layer that applies points to a map using longitude and latitude coordinates. For example, suppose that your company is head-quartered in New York City. You can create a custom point layer that displays your company icon over New York City, and that icon is always displayed whenever a map that includes New York City is shown.
The custom point layer is always on top of the other layers and is not affected by zoom levels. The custom point layer is used only by the current map view in the current analysis; it is not used by other map views, even for the same analysis.
Map
A map that consists of:
- a background or template map
- and a stack of layers that are rendered on top of each other in a window.
A map has an associated coordinate system that all layers in the map must share.
The map can be:
- an image file,
- the object representation of an image file,
- or a URL that refers to an image file.
Zoom level
Adjusts the detail of the geographic data that is shown in the map view. For example, zooming in from a country might show state and city details.
On the Administration page, the administrator specifies which layers are visible at which zoom levels. You can have multiple zoom levels for one layer, and you can have one layer associated with multiple zoom levels. When you zoom, you change the map information at that zoom level, but you do not affect the display of BI data at that level. You affect the display of BI data by drilling.
Component
A map view contains the following components:
Main content
The main content is the background or template map, which provides the background geographic data and zoom levels. The main content can be any image that can be configured using MapViewer
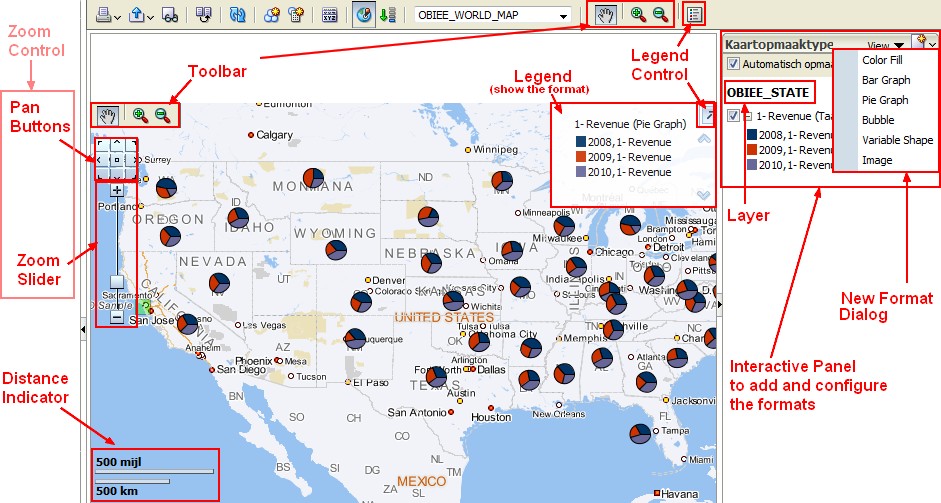
Toolbar
The toolbar is visible by default. The display of the Pan, Zoom Out, and Zoom In buttons is controlled by the “Map Properties dialog: Tools tab”. The default mode is Pan.
Zoom controls
Adjusts the zoom level. The zoom controls consists of pan buttons and a zoom slider that render in the upper left-hand corner of the map view. When the zoom control is zoomed-out all the way (ie when the thumb is at the bottom of the slider), the zoom level is set to 0 and the entire map view is displayed. The “Map Properties dialog: Tools tab” lets you determine the visibility of the zoom control. By default, the map is initially zoomed out. When you click the pan center button, the map returns to the zoom level and the center that the map was displayed with initially.
Distance Indicator
Also known as the scale tool. Provides a key to distance interpretation of the map and consists of two horizontal bar in miles (mi) and kilometers (km). The length and distance values of the bars change as the zoom level changes and as the map is panned.
Legend
The legend shows the information that relates to the current zoom level. The legend provides a read-only visual key for symbols, layers, and formatting on the map and displays all visible formats that are applied to the map. If a format is turned off, then the corresponding legend item is hidden also. If a format is turned on but zoomed out of view, then it is not displayed in the legend. The legend displays text such as “No formats defined for current zoom level” if you have no formats defined at the zoom level that is currently displayed.

Overview map
Consists of a miniature view of the main map that is shown in the lower right-hand corner of the main map. This overview map provides regional context and lets you change the viewable area of the main map without having to use the pan buttons.
The overview map is automatically hidden if the reticule cannot be shown. This hiding generally happens when the scale difference between successive zoom levels is too small to show the miniature view in the overview map.
The following items are part of the overview map:
- Reticule: Is displayed as a small window that you can move across a miniature view of the main map. The position of the reticule in the miniature map determines the viewable area of the main map. As you move the reticule, the main map is updated automatically. You can also pan in the overview map without using the reticule.
- Show/Hide button: Displays in the upper left-hand corner when the overview map is displayed. When you click the Show/Hide button, the overview map becomes invisible and only the button can be seen in the lower right-hand corner of the main map.
Interactive panel
Accompanies the view in a dashboard and in the “Compound Layout”. The interactive panel allows you to create and edit BI data formats in the Analysis editor. If a format has editable thresholds, then a slider is displayed in the Map View editor that allows you to edit thresholds by dragging the slider. The interactive panel allows you to rearrange formats within a geographic layer. For example, if the States layer has three formats, then you can select the z-order in which they display.
Dashboard users can control the visibility of formats (by turning them on or off) and can adjust format thresholds if the content designer has allowed them to.
Interactive panel can display a dialog for adding and editing formats. You can also specify the order of formats for each layer. The order affects the visibility of the formats for the layer. Formats that are displayed higher in the list overlay formats that are lower in the list.
Drill
Drilling in a map allows you to navigate through the data. Drilling is available when the Pan tool is selected, as indicated by a hand cursor. If you hover over map data, then an information window is displayed with various information about that location.
When you click a region or a point on the map, one of the following occurs:
- If the column is configured as a master for another view, then that view is updated with the latest information.
- If the column or map is configured to drill into a column or to perform a single action, then the drill or action is immediately initiated.
- If the column is configured to perform multiple actions or if multiple drills are possible, then the information window that is displayed contains a list of the actions or links for the multiple columns.
All columns in which you can drill are displayed in the information window as link text. When you click the link for a simple drill, you drill in the data, the map is redrawn with a different layer, and the information window is dismissed. If action links are defined, then you see a popup window that shows additional links. For information, see “Running Actions Associated with Action Links in Analyses and Dashboards”.
Drilling updates map formatting to reflect the newly drilled data. For some drills (such as drilling on a State), the map zooms to the specified region while simultaneously updating the formatting. How you zoom and the formats and geographic levels that the map contains affect what is displayed. Formats have particular “zoom ranges” and are visible at different zoom levels. Zooming back up might display a new format, if you zoom out past the zoom level of the drilled format.
After you have drilled down, use the zoom slider to drill back up. Use the Return button on a dashboard page to display the original map view at the zoom or drill level that was in place before you started drilling.